
Infographic: EU Shipping Industry in Numbers
Post date: 05.03.2015 , Views: 386
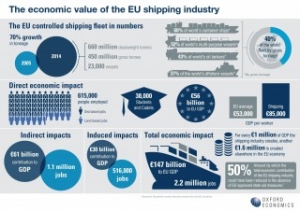 zoomCLICK TO ENLARGE A recently updated Oxford Economics study has revealed that the overall contribution of the European shipping industry to the European Union’s GDP in 2013 was around EUR 147 billion (USD 163.7bn).
Moreover, for every EUR 1 million the European shipping industry contributes to GDP itself, it creates another EUR 1.6 million elsewhere in the European economy, according to the results of the study revealed during European Shipping Week. This infographic will help you understand the impact of the shipping industry and its economic value to the European Union. World Maritime News Staff; Infographic: Oxford Economics